- The Agency Alchemist's Newsletter
- Posts
- The 3-Hour Agency Audit: How to Identify $50K+ in Hidden Profit Leaks
The 3-Hour Agency Audit: How to Identify $50K+ in Hidden Profit Leaks
The Agency Alchemist
May 26, 2025

In Today's Issue:
The Problem: Why 80% of agencies operate 20% below optimal profit margins
The Solution: A systematic 3-hour audit framework that reveals hidden profit leaks
The Process: Step-by-step diagnostic checklist you can implement this week
The Results: Real case studies showing $50K-$150K in annual recoveries
Introduction: The $73,000 Afternoon That Changed Everything
Sarah thought her digital marketing agency was thriving. With $2.1M in annual revenue and a growing team of 18, the numbers looked impressive on paper. But during a routine financial review, she discovered something that made her stomach drop.
Her agency was bleeding money—$73,000 annually—through operational inefficiencies she couldn't even see.
The revelation came during what she now calls "the most expensive afternoon of my career." In just three hours of systematic analysis, Sarah identified profit leaks that had been silently draining her business for years. Billing discrepancies, contract drift, and untracked time were collectively costing her the equivalent of two senior employees' salaries.
Sarah's story isn't unique. Research indicates that most agencies operate with 15-25% profit margins when they should achieve 35-45%. This gap represents millions of dollars in lost profit across the industry—money that's earned but never collected due to systematic operational blind spots.
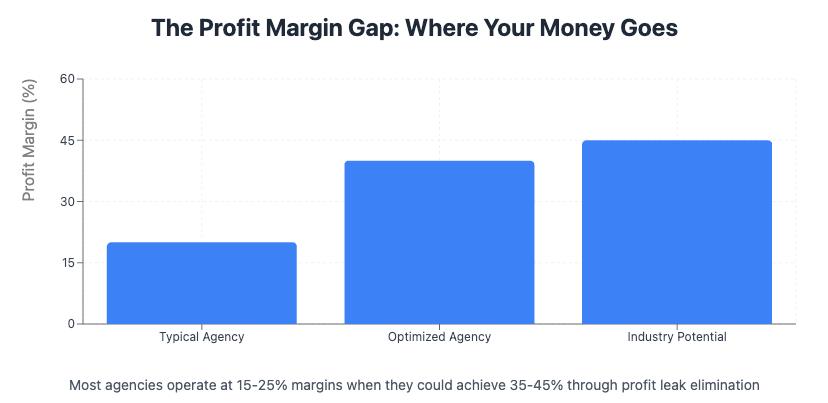
The difference between thriving agencies and struggling ones isn't always revenue growth. It's operational efficiency and profit optimization.
Understanding Revenue Leakage in Agency Operations
Revenue leakage represents money that has been earned but not collected, typically due to business process failures rather than client payment issues. For agencies, this manifests through multiple channels that compound over time.
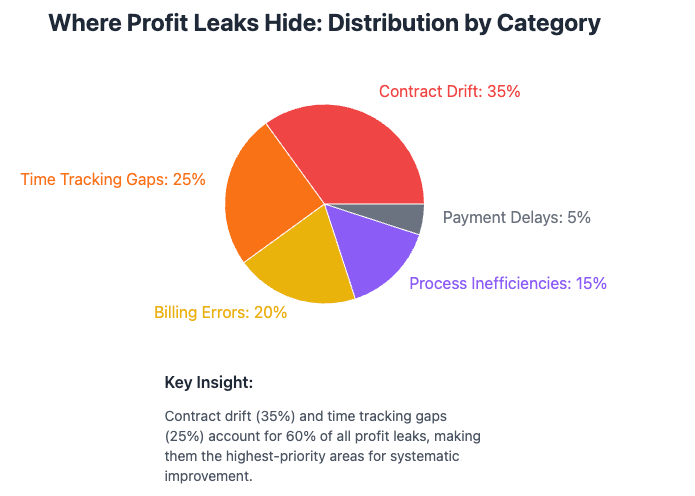
The most common profit leak categories include:
Billing inaccuracies - Scope changes that never make it to invoices
Contract drift - Services delivered beyond agreed terms without rate adjustments
Time tracking gaps - Billable hours that disappear into administrative black holes
Expense miscategorization - Costs attributed to wrong projects or not captured at all
Payment processing inefficiencies - Late fees, failed collections, and extended payment cycles
Why Traditional Financial Reviews Miss These Leaks
Most agencies rely on monthly P&L reviews and annual financial assessments. While these provide high-level visibility, they miss the granular operational inefficiencies that create profit leakage.
Traditional accounting focuses on what happened, not what should have happened. The gap between these two realities is where profit leaks hide.
Consider this example: An agency consistently delivers 5-10 hours of additional work per client project due to scope creep, but only bills for the original estimate. Over 50 projects annually, this represents 250-500 unbilled hours—potentially $50,000+ in lost revenue.
The 3-Hour Profit Leak Diagnostic Framework
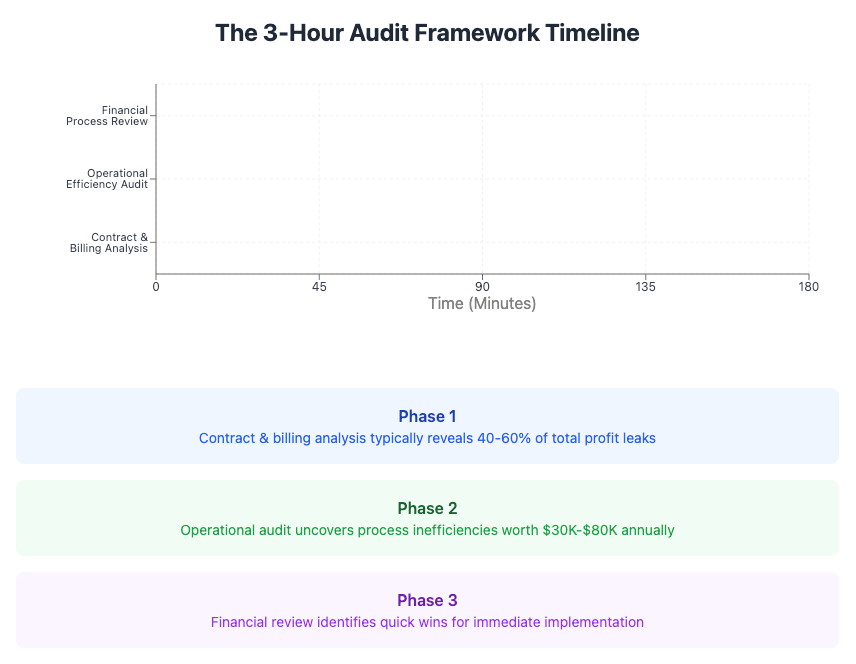
Phase 1: Contract and Billing Analysis (60 Minutes)
Step 1: Contract Compliance Review Pull your last 10 completed projects and compare final deliverables against original contracts. Look for:
Services delivered beyond scope
Timeline extensions without rate adjustments
Additional revisions provided at no charge
Deliverables that exceed contractual requirements
Step 2: Billing Accuracy Assessment Compare project timesheets against final invoices for the same 10 projects:
Hours worked vs. hours billed
Expense reimbursements requested vs. collected
Revision rounds completed vs. charged
Team members involved vs. billed rates applied
Expected Findings: Most agencies discover 15-30% more billable activity than they actually invoiced.
Phase 2: Operational Efficiency Audit (90 Minutes)
Step 3: Time Tracking Analysis Review your team's time allocation across all activities:
Administrative time that should be billable
Client work performed outside tracked hours
Project management time not allocated to clients
Business development activities that should be project-specific
Step 4: Process Bottleneck Identification Map your typical project workflow and identify delays:
Client approval cycles that extend project timelines
Internal review processes that create redundancy
Communication breakdowns that require rework
Resource allocation conflicts that slow delivery
Step 5: Technology and Tool Assessment Evaluate your current systems for efficiency gaps:
Manual processes that could be automated
Duplicate tools serving similar functions
Integration failures creating manual data entry
Reporting processes that consume excessive time
Phase 3: Financial Process Review (30 Minutes)
Step 6: Payment and Collection Analysis Examine your financial processes for improvement opportunities:
Average payment collection time vs. industry standards
Failed payment processing rates and causes
Invoice dispute resolution time and costs
Late payment follow-up effectiveness
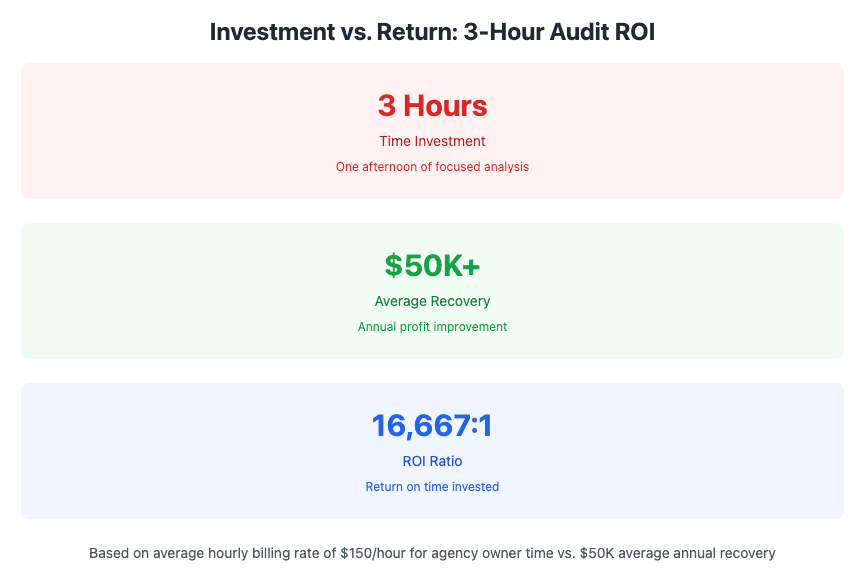
Expected Outcome: This systematic review typically identifies $50,000-$150,000 in annual profit recovery opportunities for agencies generating $1M-$5M in revenue.
Real-World Implementation Case Studies
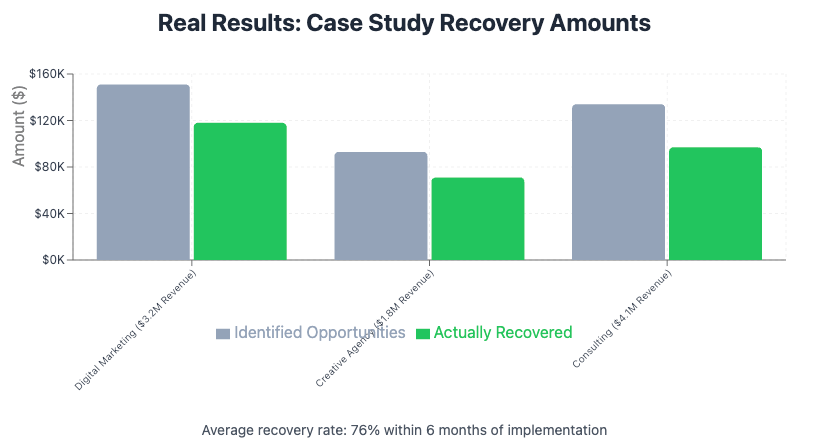
Case Study 1: Digital Marketing Agency Recovery
Agency Profile: $3.2M annual revenue, 24 employees, specializing in B2B lead generation
Audit Results:
Contract drift losses: $89,000 annually in uncompensated scope expansion
Time tracking gaps: $34,000 in unbilled strategic consulting hours
Process inefficiencies: $28,000 in redundant workflow costs
Total recovery opportunity: $151,000 annually
Implementation Impact: Within 90 days of implementing systematic tracking and billing processes, the agency recovered 78% of identified opportunities, adding $118,000 to annual profit.
Case Study 2: Creative Agency Transformation
Agency Profile: $1.8M annual revenue, 16 employees, focus on brand development and creative services
Audit Results:
Revision cycle losses: $43,000 in unlimited revision commitments
Project management gaps: $31,000 in unallocated PM time
Technology redundancy: $19,000 in overlapping tool subscriptions
Total recovery opportunity: $93,000 annually
Implementation Impact: The agency restructured contracts to include revision limits and implemented project-specific billing for management time, recovering $71,000 in the first year.
Case Study 3: Consulting Agency Optimization
Agency Profile: $4.1M annual revenue, 31 employees, management consulting focus
Audit Results:
Billing accuracy issues: $67,000 in undercharged senior consultant time
Expense tracking gaps: $29,000 in unreimbursed client expenses
Administrative inefficiency: $38,000 in non-billable time that should be client-charged
Total recovery opportunity: $134,000 annually
Implementation Impact: Through systematic process improvements and billing restructuring, the agency recovered $97,000 within six months.
Implementation Strategy: From Audit to Action
Week 1: Conduct Your Diagnostic Audit
Use the 3-hour framework to identify your specific profit leaks. Document everything systematically and quantify potential recovery amounts for each identified issue.
Critical Success Factors:
Focus on data, not assumptions
Quantify everything in dollar terms
Prioritize highest-impact opportunities
Involve key team members in the process
Week 2-4: Design Remediation Systems
Create systematic processes to address identified leaks:
For Contract Management:
Implement scope change order processes
Create revision limit policies
Establish rate escalation procedures for timeline extensions
For Time Tracking:
Deploy comprehensive time tracking systems
Create project-specific billing categories
Implement administrative time allocation policies
For Process Optimization:
Automate manual workflows where possible
Eliminate redundant tools and processes
Create standardized project management protocols
Month 2-3: Monitor and Refine
Track implementation progress and measure results:
Monthly profit margin analysis
Client profitability assessments
Process efficiency measurements
Team productivity metrics
Expected Timeline for Results: Most agencies see measurable profit improvements within 60-90 days of implementation, with full recovery potential realized within 6 months.
Long-Term Profit Optimization Strategy
Systematic Monitoring and Continuous Improvement
Successful profit optimization requires ongoing attention and systematic monitoring. Implement quarterly audit cycles to identify new leaks and optimize existing processes.
Quarterly Review Focus Areas:
Contract performance against profitability targets
Time allocation efficiency across all projects
Technology ROI and utilization rates
Client profitability and relationship optimization
Technology Integration for Automated Monitoring
Modern business intelligence tools can automate much of the diagnostic process, providing real-time visibility into profit leak indicators. Consider implementing integrated systems that connect project management, time tracking, and financial reporting.
Key Technology Capabilities:
Automated billing discrepancy detection
Real-time project profitability monitoring
Contract compliance tracking
Predictive profit leak identification
Building a Culture of Operational Excellence
Long-term success requires team buy-in and systematic attention to operational efficiency. Create accountability systems and performance metrics that reinforce profit optimization behaviors.
Cultural Implementation Strategies:
Regular team training on efficiency best practices
Performance metrics that include profit optimization
Recognition systems for process improvement contributions
Client communication strategies that support profitable operations
Conclusion: Your Next Steps
The agencies that thrive in competitive markets aren't necessarily those with the highest revenue—they're the ones with optimized operations and maximized profit margins. The difference between a 20% margin and a 40% margin isn't just numbers on a financial statement; it's the foundation for sustainable growth, competitive resilience, and strategic flexibility.
Your 3-hour audit investment can reveal profit opportunities that transform your agency's financial trajectory. The question isn't whether you have profit leaks—research shows that virtually all agencies do. The question is whether you'll take the systematic approach necessary to find and fix them.
Start your audit this week. The $50,000+ you recover could fund your next strategic hire, technology upgrade, or market expansion initiative.
Ready to begin? Block three hours on your calendar this week and work through the diagnostic framework. Your future self—will thank you.